2015 to 2017
Hydro-meteorological variability
Precipitation, temperature, and area under severe to extreme droughts undergo multiyear to decadal variability (Figures 1 and 2).
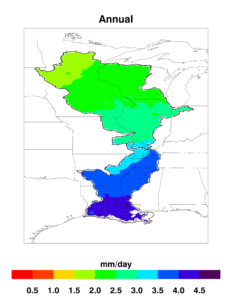
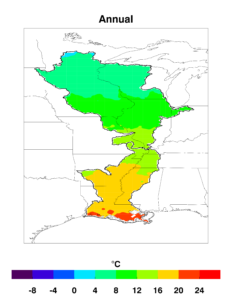
Figure 1: Precipitation and surface air temperature anomalies averaged over the Mississippi River Basin from 1961 to 2010.
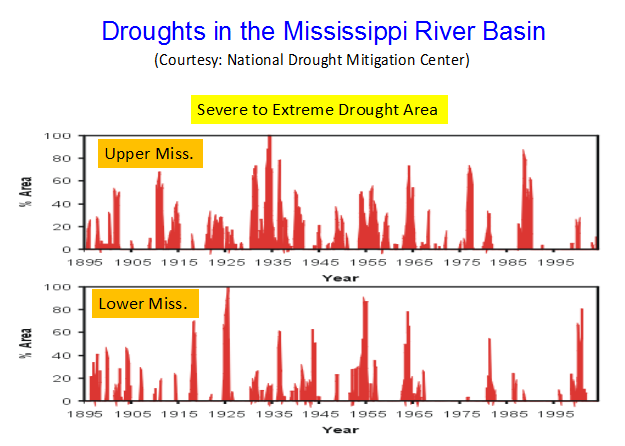 Figure 2: Percent area of the Upper and Lower Mississippi River Basins under severe to extreme drought from 1895 to 2004.
There are substantial precipitation and daily maximum temperature anomalies associated with even an average intensity Pacific Decadal Oscillation (PDO) cycle (Fig. 3) or an average intensity cycle of the tropical Atlantic sea-surface temperature (SST) gradient variability (TAG for brevity) (Fig. 4). In the positive phase of the PDO (PDO+), there are positive precipitation anomalies (with respect to 50-year average) (Fig. 3a) and below-average temperature anomalies (with respect to 50-year average) (Fig. 3c) in almost the entire MsRB. In the negative phase of the PDO (PDO–), these anomalies are generally below- (Fig. 3b) and above-average (Fig. 3d), respectively. Thus, the hydro-meteorology of the MsRB is mostly wetter and cooler in PDO+ and dryer and warmer in PDO–.
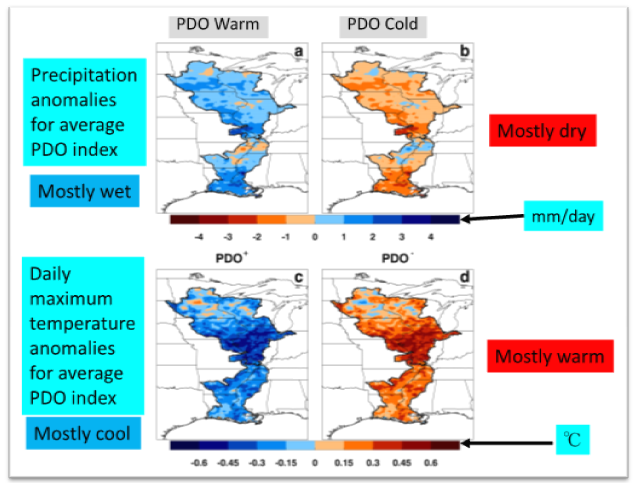
Figure 3: Precipitation and daily maximum temperature anomalies in the Mississippi River Basin associated with positive and negative phases of the PDO from 1961 to 2010. (a) PDO+, precipitation; (b) PDO–, precipitation; (c) PDO+, temperature; and (d) PDO–, temperature.
In the positive phase of the TAG (TAG+), there are negative precipitation anomalies (with respect to 50-year average) (Fig. 4a) and above-average temperature anomalies (with respect to 50-year average) (Fig. 4c) in almost the entire MsRB. In the negative phase of the TAG (TAG–), these anomalies are generally above- (Fig. 4b) and below-average (Fig. 4d), respectively. Thus, the hydro-meteorology of the MsRB is generally dryer and warmer in TAG+ and wetter and cooler in TAG–. Variability of the West Pacific Warm Pool (WPWP) sea-surface temperatures (SSTs) and El Niño-La Niña events also have substantial associations with MsRB hydro-meteorology.
Inland, water-borne transportation
The Middle Mississippi River (MMR) is the segment of the Mississippi River from the confluence with the Missouri River near St. Louis, Missouri, to the confluence with the Ohio River near Cairo, Illinois – a distance of approximately 320 km (200 miles). Approximately 120 million tons of cargo is shipped on the MMR each year. Agricultural products are the main cargo shipped, with corn, soybean, and wheat making up a large percentage of the total. Other major cargoes shipped include coal, raw materials (including sand, gravel, iron ore, and scrap iron), manufactured products, petroleum products, and chemicals. Much of the agricultural cargo is destined for export through ports on the Gulf of Mexico. There are no locks or dams downstream of St. Louis to maintain water levels, so inland navigation on this stretch of the Mississippi River is vulnerable to natural flow variations and, therefore, navigation on this stretch of the Mississippi River is perhaps the most vulnerable to natural flow variations due to climate variability. Dikes, bank revetments, and dredging are used to maintain a navigable channel in the MMR.
Figure 4 shows observed DCV indices, river flows in the MMR and elsewhere in the MsRB, cargoes transported on the MMR, and dredging volume. Based on these and other data, an ensemble of case studies of high- and low-flow epochs using empirical data is developed to aid quantitative analyses. A descriptive analysis method is a better approach rather than a purely statistical analysis method when inter-relationships among processes and impacts, as represented in empirical data, may be physically consistent but not statistically stationary. Also, hydro-meteorology and agriculture are impacted by several DCV phenomena simultaneously, so there may not be a stationary statistical relationship with any one phenomenon. More over, crop yields, productions, and prices may suffer both in low and high precipitation epochs; water-borne transportation may suffer both in high- and low-flow epochs; and dredging may be required both in high- and low-flow epochs, but the timing of the dredging may be different in the two epochs. Therefore, a descriptive approach was adopted in diagnosing possible connections among DCV phenomena, precipitation and temperature, river flow, crop production, water-borne transportation, and dredging. The analyses consisted of visual inspections of data time series and assembly of “word pictures” of sequences of events from DCV to hydro-meteorology to river flow; and to crop production, transportation, and dredging. Reasonably detailed, but only for some years, information about the Mississippi waterway operations, and types and numbers of vessels used at ports on the Mississippi River are available from the USACE for some of these prominent epochs and they are also included to make the “word pictures” more complete.
Based on time series of Mississippi River flow at St. Louis and other locations along the Mississippi and Missouri Rivers, the following periods of high and low flows were selected as case study epochs. The high-flow/flood years are 1993-94 and 2008-11. The low-flow/drought years are 1987-89, 2000, 2003-06, and 2012-13. Cargo transportation data are not available before 1988, therefore only wet/dry epochs beginning in 1988 are described. All four high-flow epochs at St. Louis occurred during the negative phase of the TAG variability which is associated with above-average precipitation, below-average temperature, and above-average river flow in the MRB and the MsRB. The PDO was either in the positive phase or had a small negative amplitude; the former is associated with above-average precipitation, below-average temperature, and above-average river flow in the MRB and the MsRB. During most of the six low-flow epochs at St. Louis, the TAG variability was in the positive phase and/or the PDO and Niño3.4 were in the negative phase; these phases are associated with below-average precipitation, above-average temperature, and below-average river flow. Thus, specific phases of the DCV phenomena were associated with the ten high-flow and low-flow epochs. Two of these case studies are shown here in Figures 5 and 6.
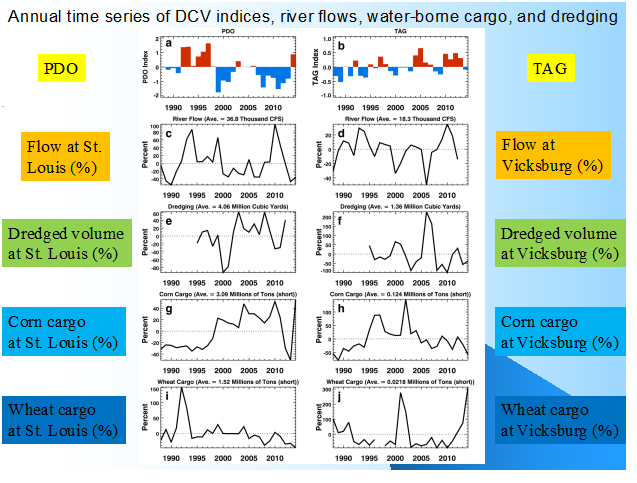 Figure 4: Annual time series of (a) the Pacific Decadal Oscillation, (b) the tropical Atlantic sea-surface temperature gradient, (c) Mississippi River flow anomalies (%) at St. Louis, (d) Mississippi River flow anomalies (%) at Vicksburg, (e) dredged volume anomalies (%) at St. Louis, (f) dredged volume anomalies (%) at Vicksburg, (g) corn cargo anomalies (%) at St. Louis, (h) corn cargo anomalies (%) at Vicksburg, (i) wheat cargo anomalies (%) at St. Louis, and (j) wheat cargo anomalies (%) at Vicksburg. The 1988-2014 average value is given above each box from c to j.
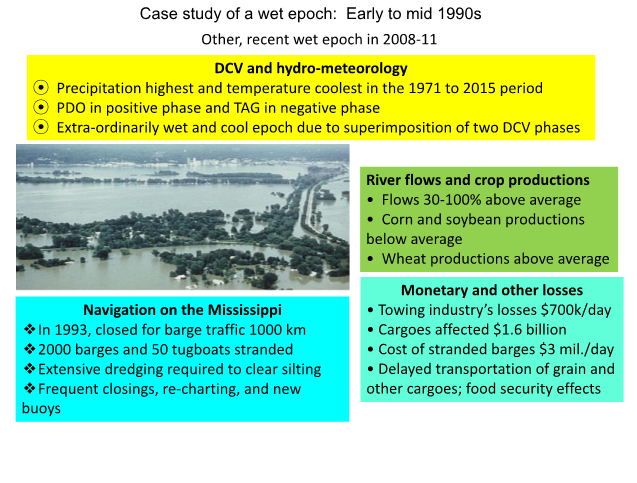 Figure 5: A case study of impacts on water-borne transportation in a wet epoch in early to mid 1990s in the Mississippi River Basin.
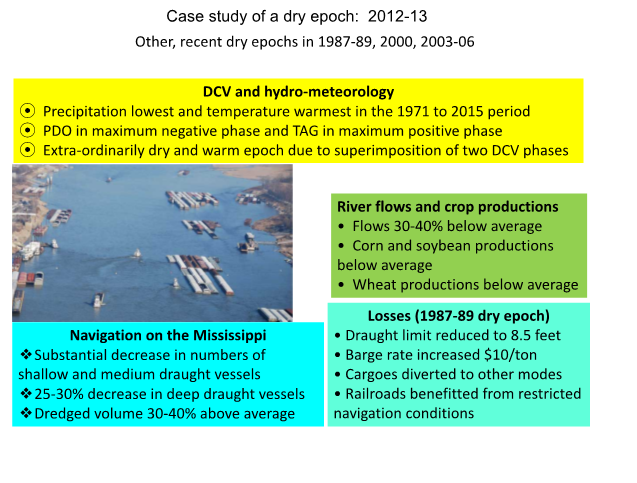 Figure 6: A case study of impacts on water-borne transportation in a dry epoch in 2012-13 in the Mississippi River Basin.