To associate forcing anomalies with DCV phenomena, monthly forcings (precipitation and temperature) and DCV indices for the 1950 to 1999 period were low-pass filtered to allow periods equal to or longer than eight years to pass through with no attenuation of amplitude; amplitudes of all periods shorter than eight years were set to zero. Then, a regression analysis was carried out between each of the filtered, monthly forcings and filtered, monthly PDO, WPWP, and TAG indices. Linear regression equations were fitted for each calendar month between each forcing and each DCV index at each location. An example of the procedure, a regression equation for January, fitted between low-pass filtered, January precipitation anomaly ŕ and the PDO index PDOI for the 1950 to 1999 period, is given here:
ŕ (year, January) = mPDO (January) * PDOI (year, January) + CPDO (January)
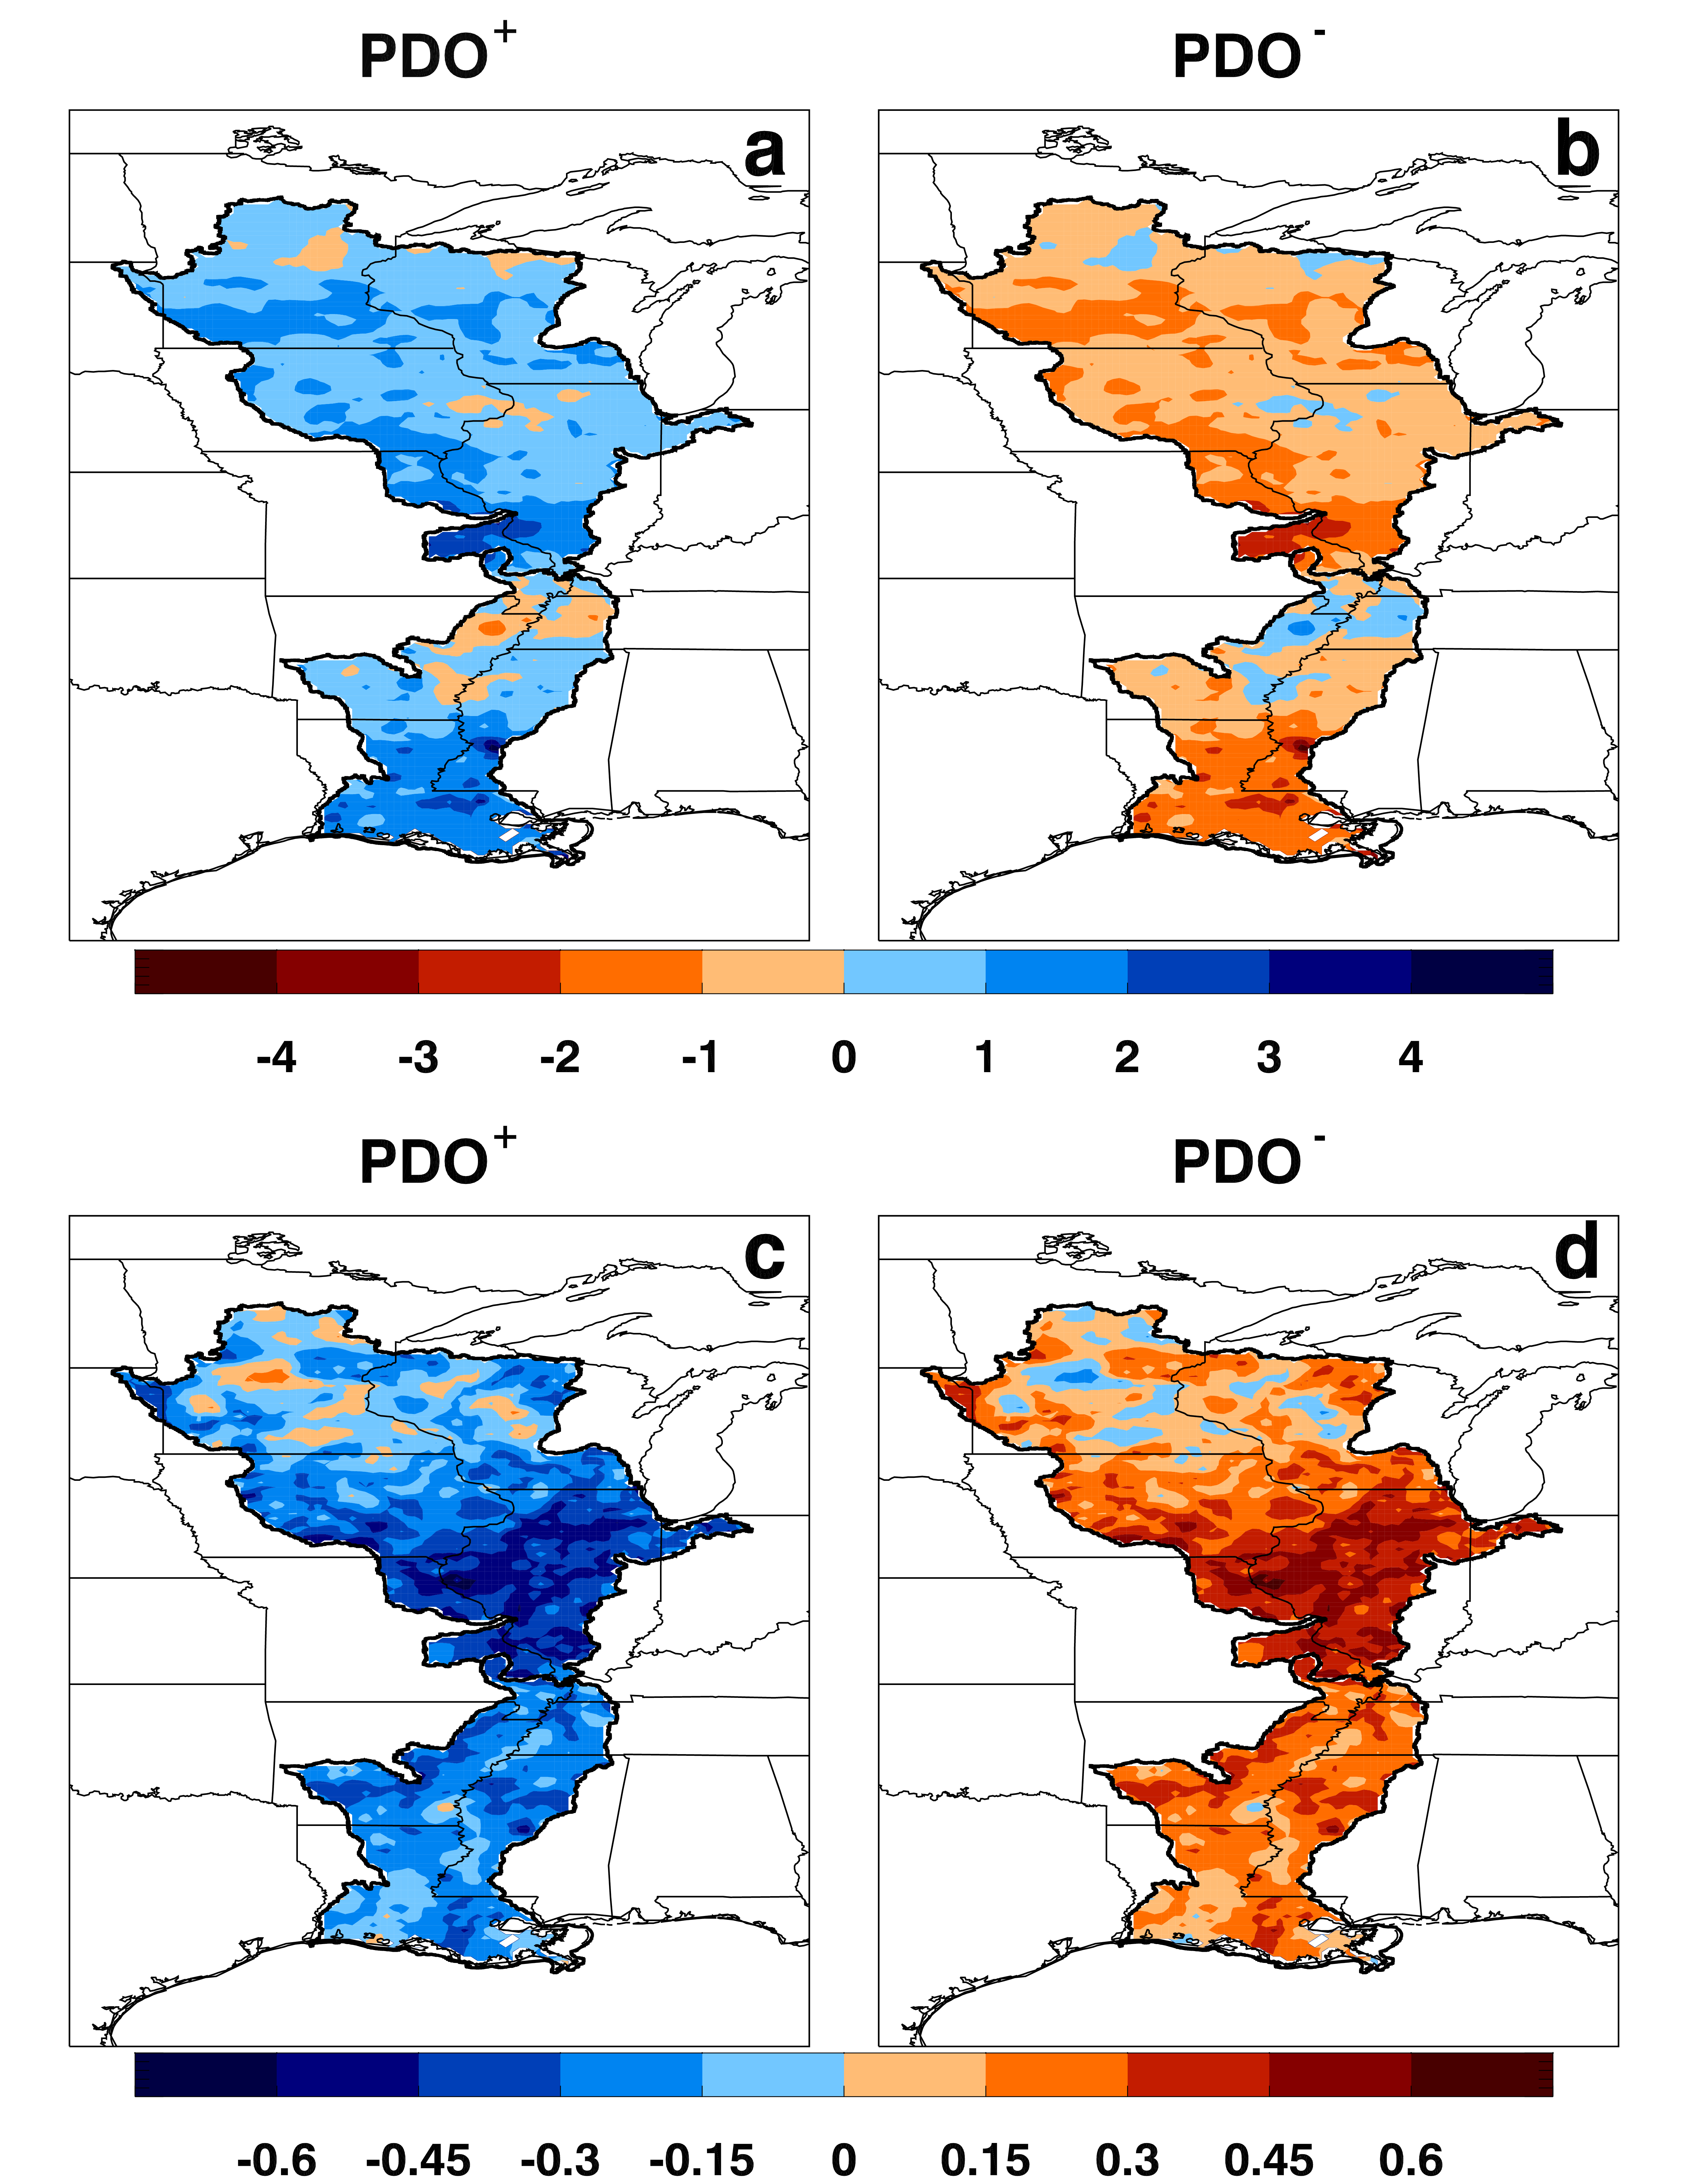
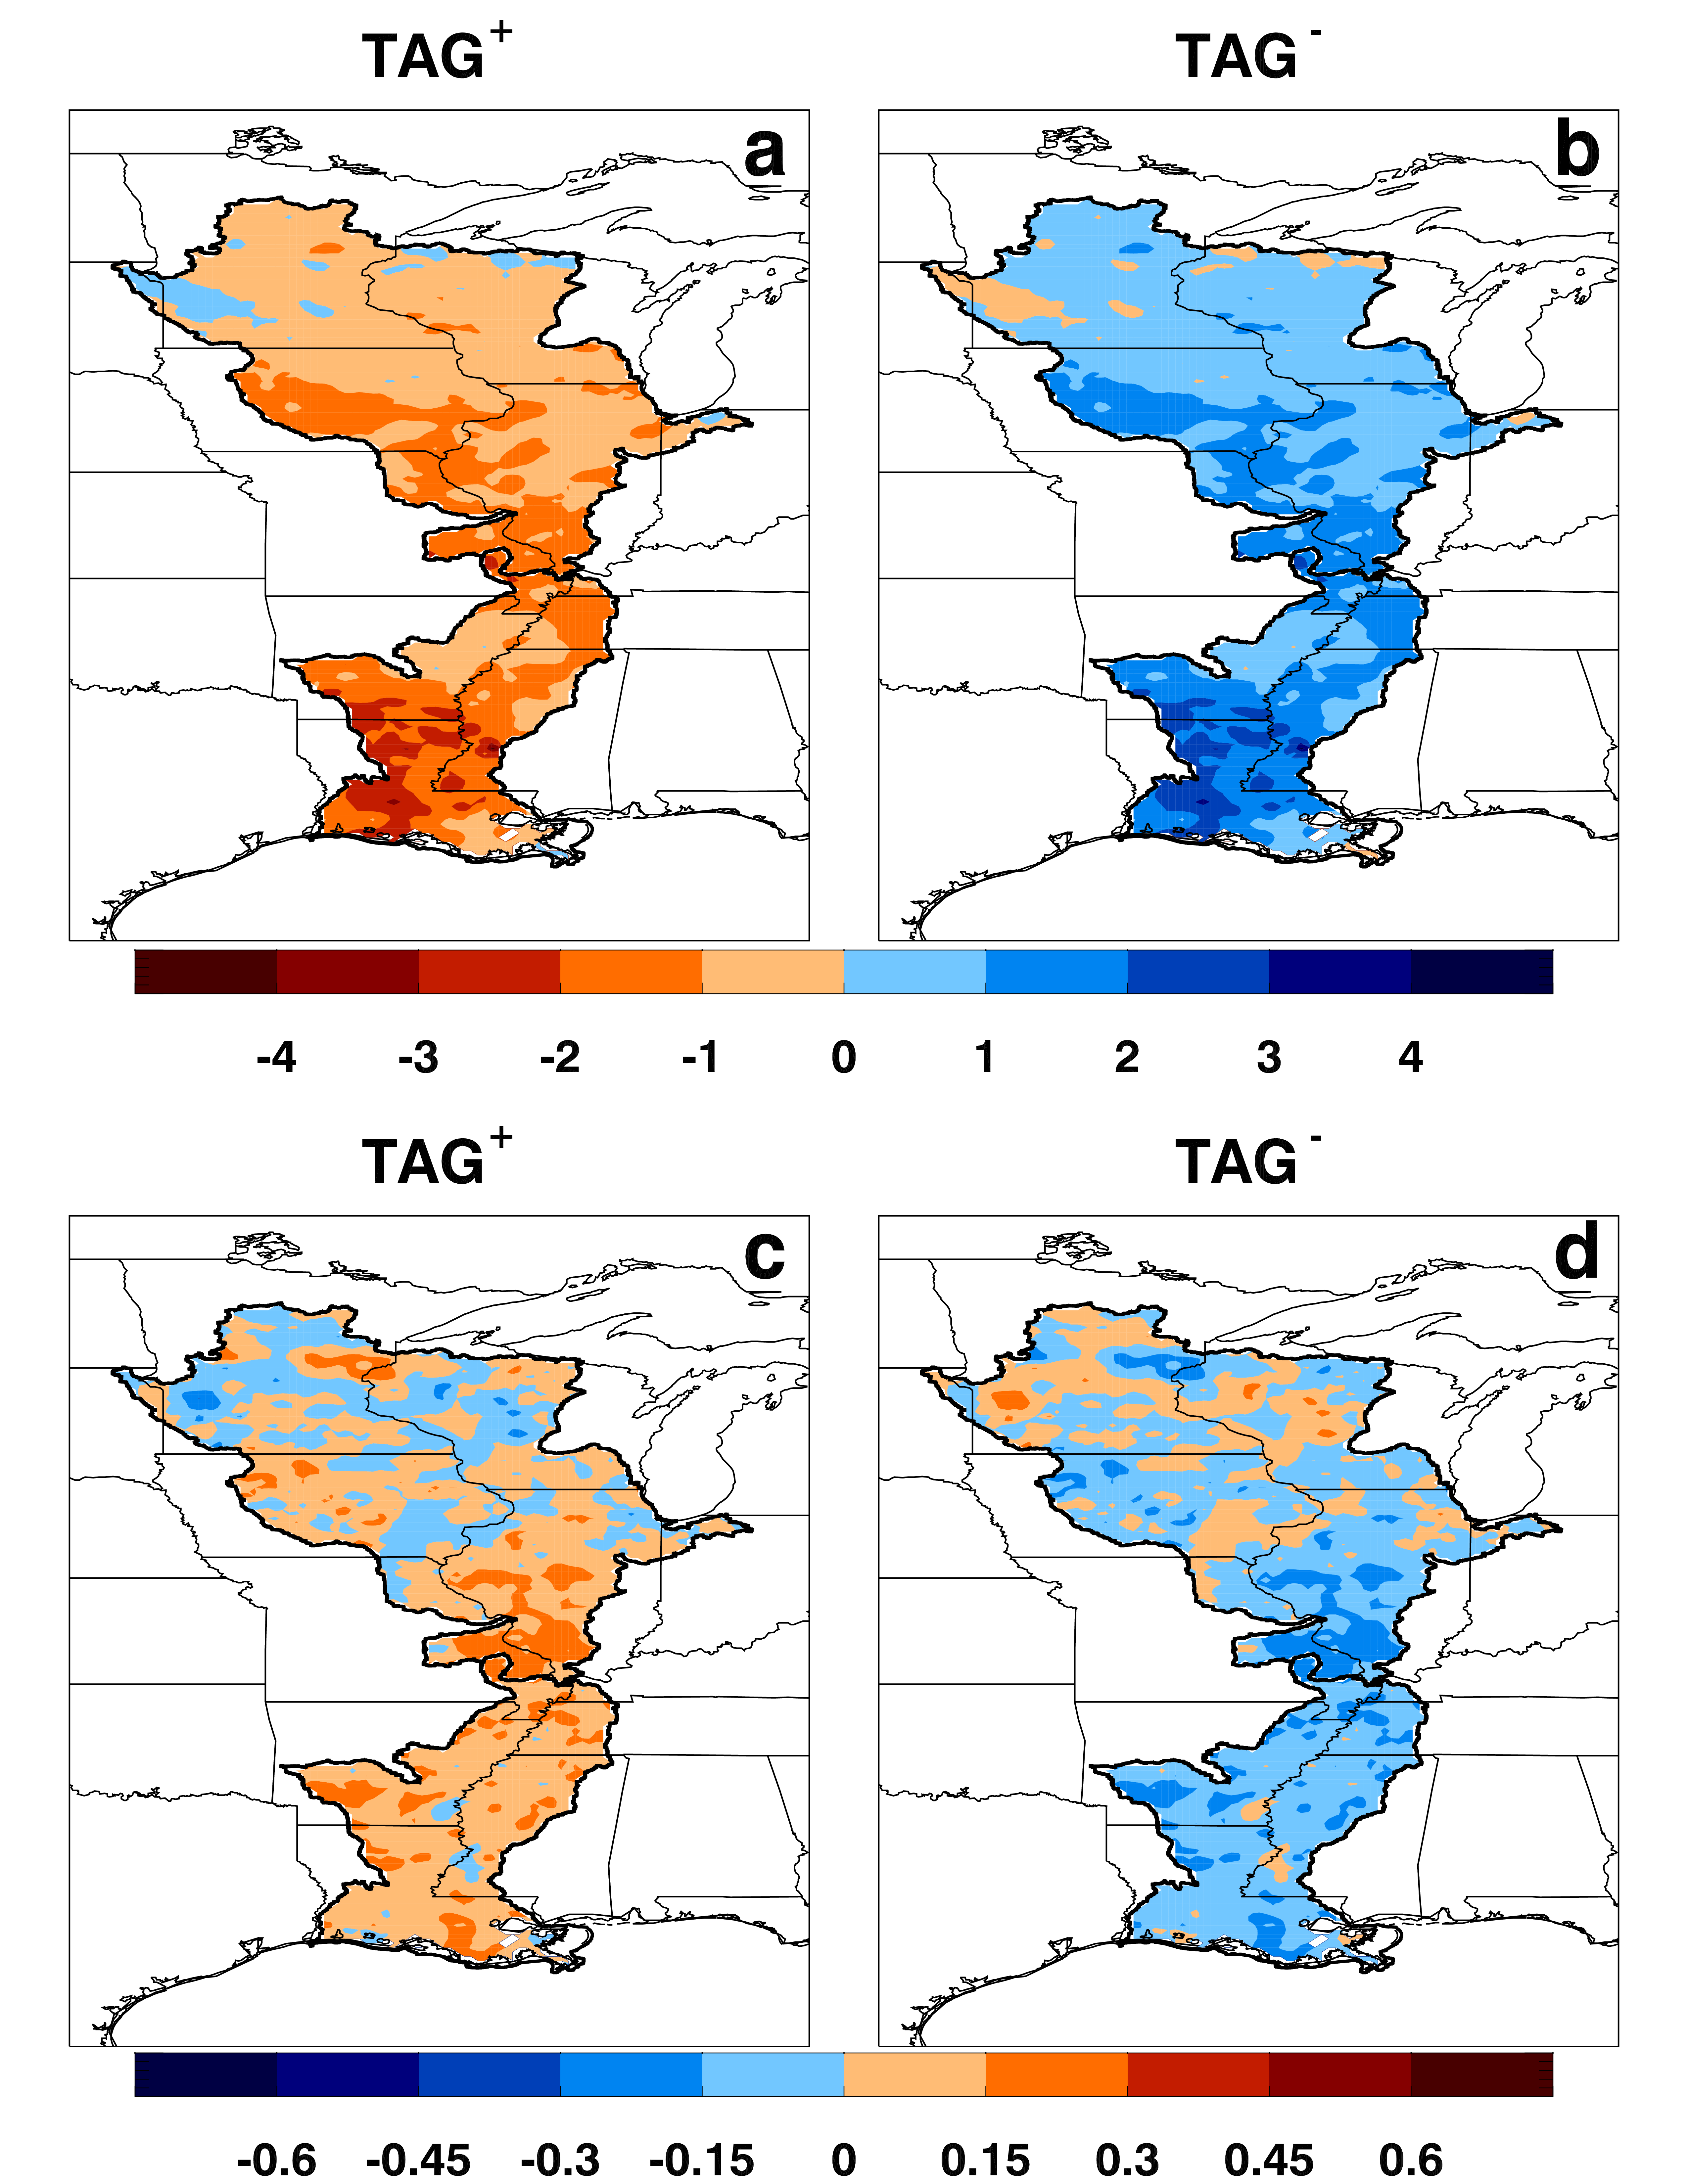
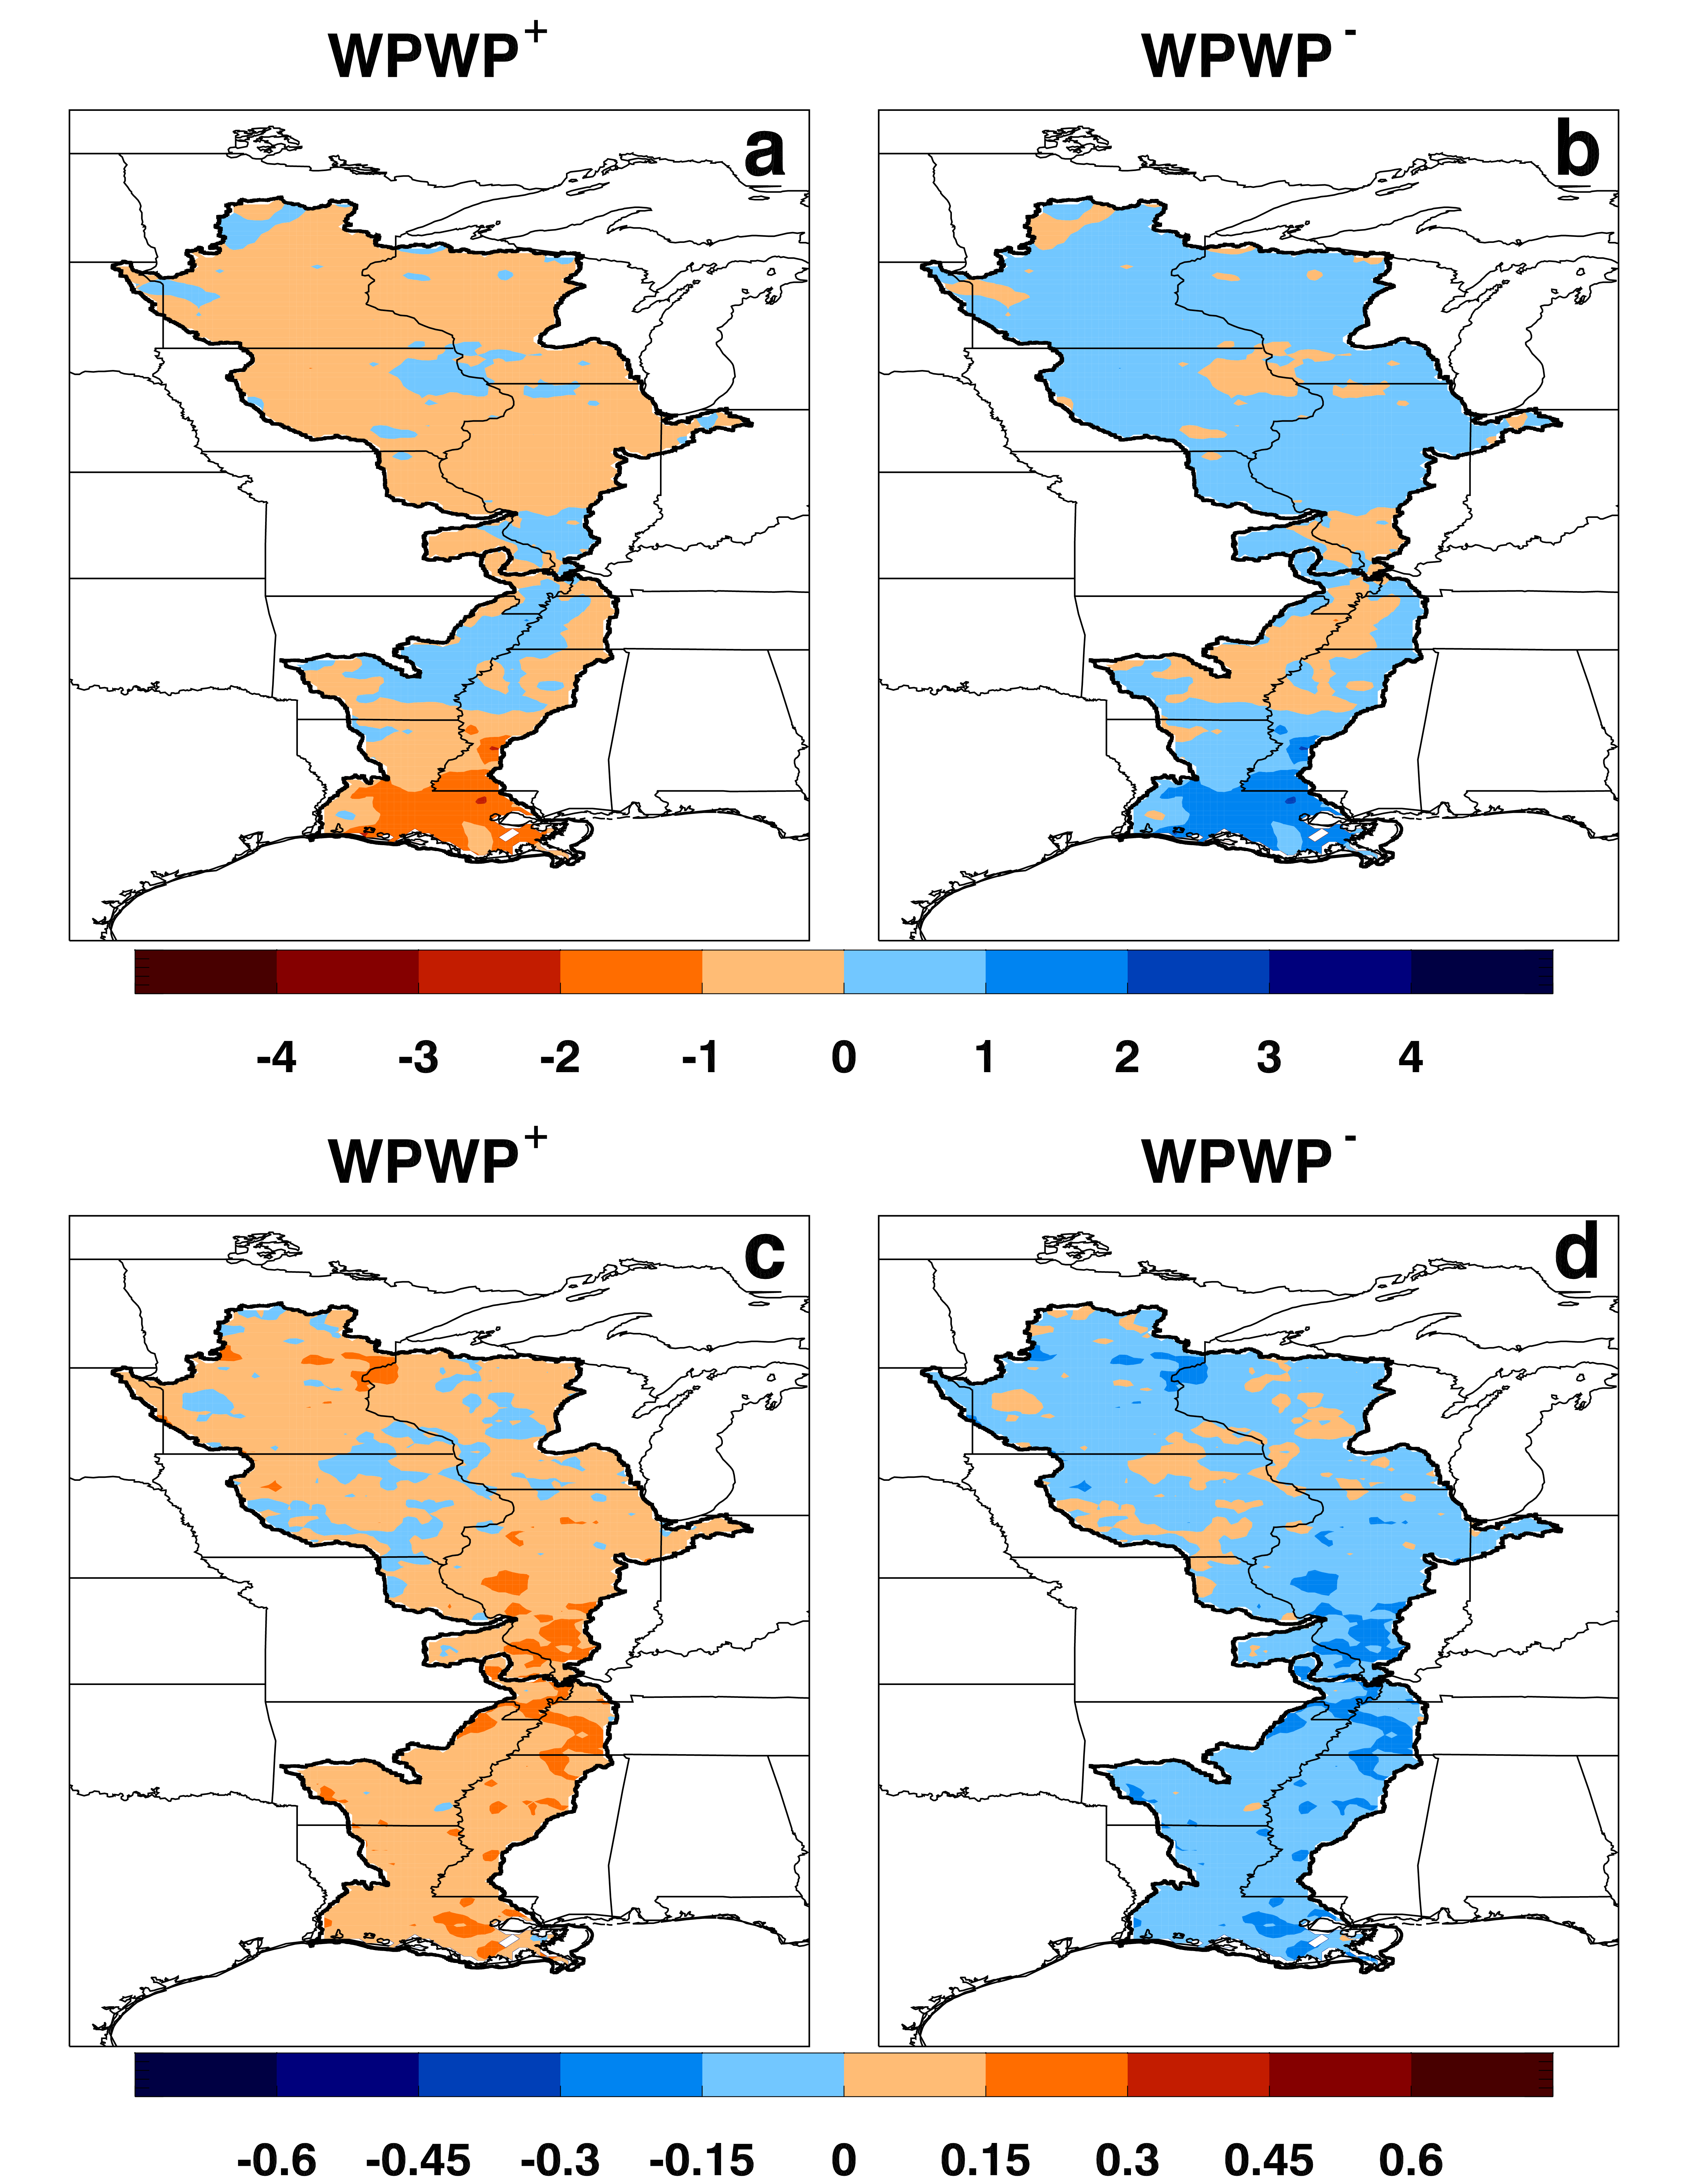
In the next step, using the regression coefficients, forcing anomalies corresponding to average positive or average negative value of the corresponding DCV index were generated. For example, slope mPDO and intercept CPDO for January were used, along with an average positive value of PDOI (PDOI+) over the 1950 to 1999 period, to create precipitation anomaly RPDOI+ corresponding to PDOI+ for January.
RPDOI+ (January) = mPDO (January) * PDOI+ (January) + CPDO (January)
Below are the precipitation and temperature forcings found from opposite phases of average DCV scenarios.


